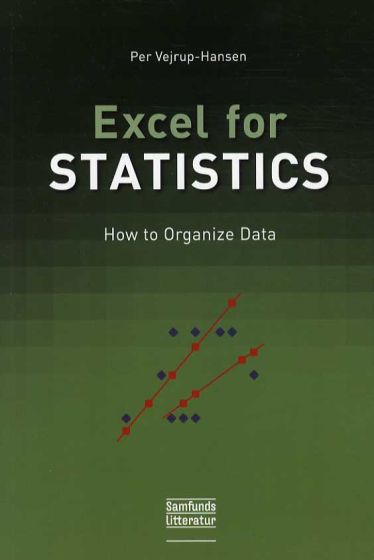
Excel for Statistics
This booklet is a handbook on statistical software, not on statistical theory and methodology as such. The focus is on how to create input for Excel s statistical functions and data analyses when using raw data. The need for organizing data applies to survey data in particular. Also, a presentation of basic Excel targeted at statistics is included. Prior experience with Excel is not presupposed. In conclusion, output by Excel s statistical functions and data analyses is briefly interpreted.
The text presupposes a basic knowledge of quantitative statistics. It can be used in a statistics course as a companion to Excel statistical software. Students writing a thesis can use the text as a handbook when applying Excel as readily available statistical software.
| Undertitel | How to Organiza Data |
|---|---|
| Forfatter | Per Vejrup-Hansen |
| Forlag | Samfundslitteratur |
| Indbinding | Paperback |
| Thema koder | Sandsynlighedsregning og statistik |
| Varegruppe | Skole- og lærebøger, div. |
| Ekspedition | DBK |
| Udgivelsesdato | 18. jul. 2013 |
| Sideantal | 100 |
| Bredde | 155 |
| Højde | 230 |
| Dybde | 9 |
| Vægt | 185 |
| Første udgave | 2013 |
| Oplagsdato | 8. sep. 2017 |
| Oplag | 2 |
| Udgave | 1 |
| ISBN-13 | 9788759317891 |
| ISBN-10 | 8759317892 |
| EAN | 9788759317891 |
| Sprog | eng |
| Orignalsprog | dan |
| Omslagsgrafiker | Jesper Frederik Emil Hansen |
| Illustreret i farver/sh | Nej |


